
Welcome to the Fullcount Devlog, where we’ll share glimpses into the process of preparing Fullcount for launch.
Fullcount is a fully on-chain baseball game that Moonstream began developing in October of 2023. You can read more about the game in our PRFAQ.
The publication of this first devlog accompanies our deployment of a new Fullcount contract which we will be testing over the coming week. The devlog describes our process for tuning the game, i.e., adjusting the probability distributions that the game uses to determine outcomes, based on the batter’s and pitcher’s selections.
We used four probability distributions for the very earliest version of the game. This week, we re-tuned based on data from the pre-alpha and to prepare for some upcoming changes to the game.
Our goals in re-tuning were:
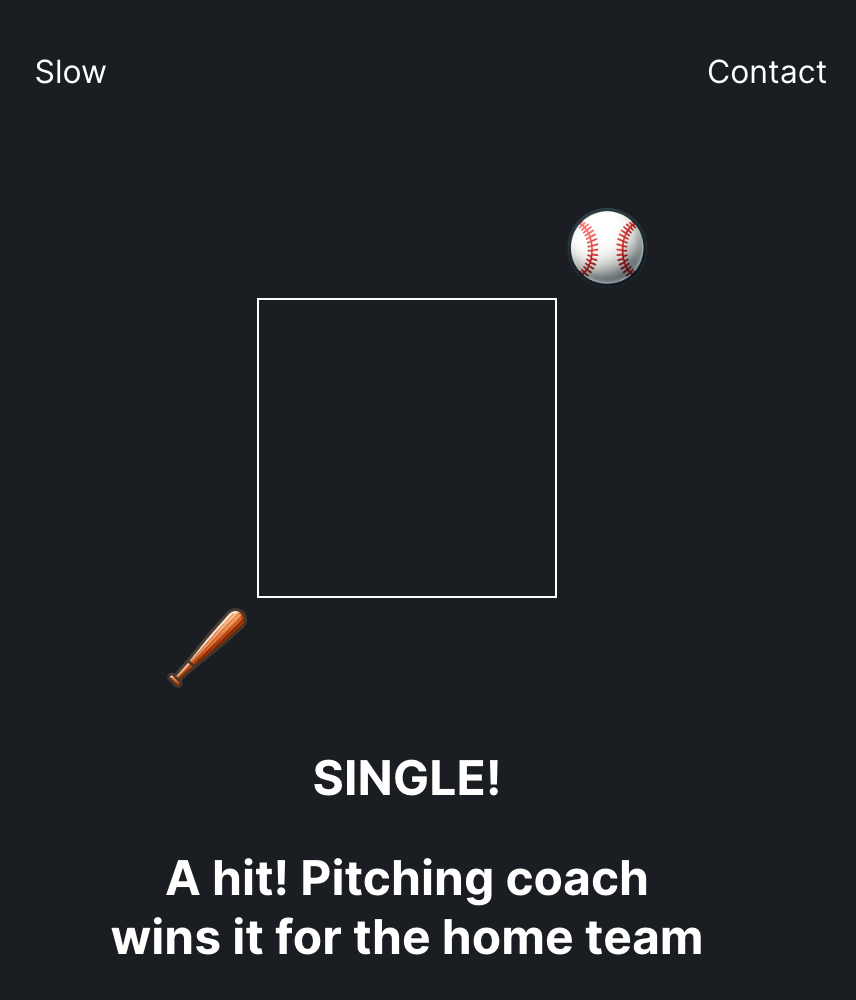
(1) To update the probability distributions in the Fullcount contract to avoid situations like the ones pictured below. Right now, batters sometimes get an extremely improbable hit, and that can make the game look broken to players who don’t know how outcomes are calculated.
(2) To add foul balls to the game. This week we’re testing a new version of the game contract that lets players play full at-bats instead of a single pitch. It should add a lot of excitement to the pitcher–batter showdown! Having foul balls as a possible outcome is part of that transition.
Original distributions
After both players have committed and revealed their moves, the game calculates the distance between the pitch and the swing. First, it calculates the L1 distance by adding the vertical and horizontal distances between the pitch and the swing: |v1-v2| + |h1-h2|. Then it adds a penalty of +1 if the swing type (power or contact) is not the optimal choice for the pitch type (fast or slow). Power swings are optimal for slow pitches and contact for fast.
Based on the total distance between pitch and swing, the game selects one of the following probability distributions to use to determine the outcome of the pitch.
Likelihood of outcomes based on the distance between pitch and swing (original)
| 0 | 1 | 2 | GT2 | |
| Strikeout | 0 | 500 | 2000 | 6000 |
| Walk | 0 | 0 | 0 | 0 |
| Single | 4458 | 3185 | 1910 | 636 |
| Double | 1408 | 1005 | 603 | 201 |
| Triple | 126 | 90 | 55 | 19 |
| HR | 1008 | 720 | 432 | 144 |
| In-play out | 3000 | 4500 | 5000 | 3000 |
In the case pictured below, the vertical distance is one, and the horizontal distance is two. If the pitch and swing types match, that means the total distance is three. If they do not match, the total distance is four. Either way, the results will be calculated according to the GT2 (greater than two) distribution in the table above. The batter has a 60% chance of striking out, a 6.36% chance of hitting a single, and a 1.44% chance of hitting a homerun.

When we established these probability distributions, we were guided by two considerations:
- Do the outcomes make sense, given the distance? That is, are they likely to match what would happen in a baseball game if the batter aimed a swing at a spot this distance from the location of the pitch?
- Will the distribution of outcomes for repeated plays of the game roughly match the MLB averages for the percentage of strikeouts, singles, home runs, walks, etc. per plate appearance? We based this on stats from the 2023 season.
Problem 1: Occasional unsatisfying outcomes
The original probability distribution intentionally allowed for some rare, unexpected outcomes. For example, a batter who misses by 3 still has a 6.36 chance of hitting a single and a 1.44 chance of hitting a homerun.
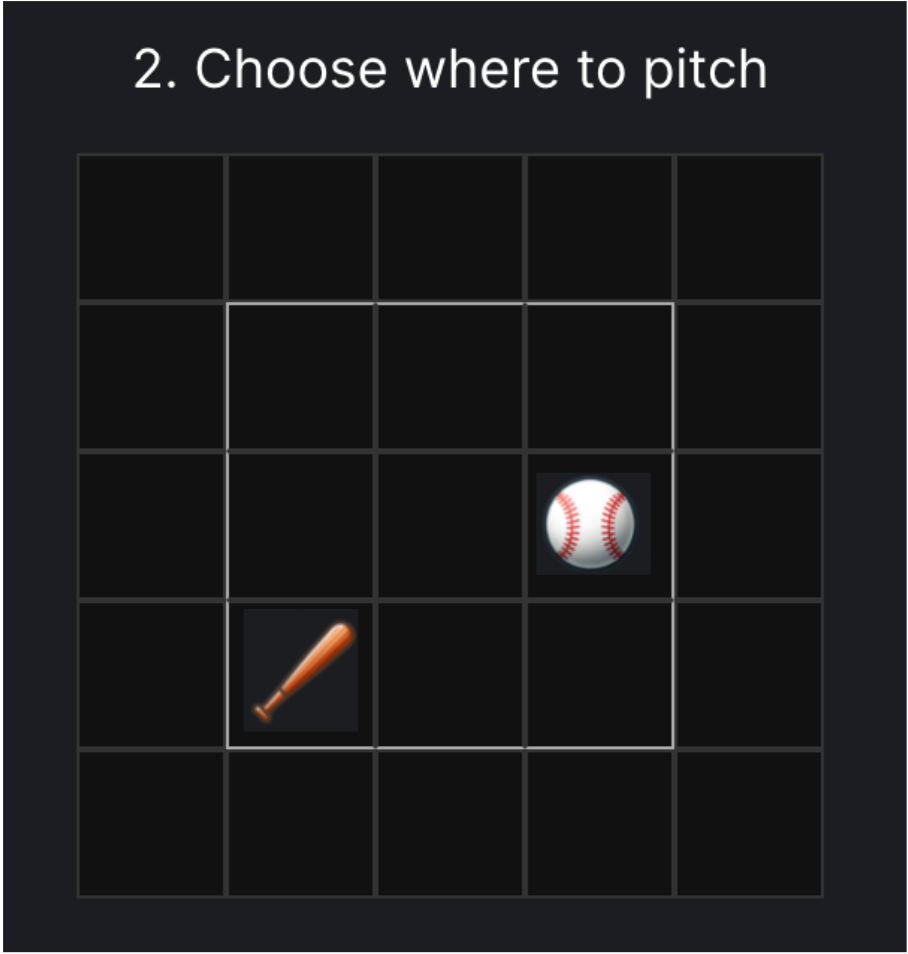
A distance of three could look like any of the following:
A. B. C.

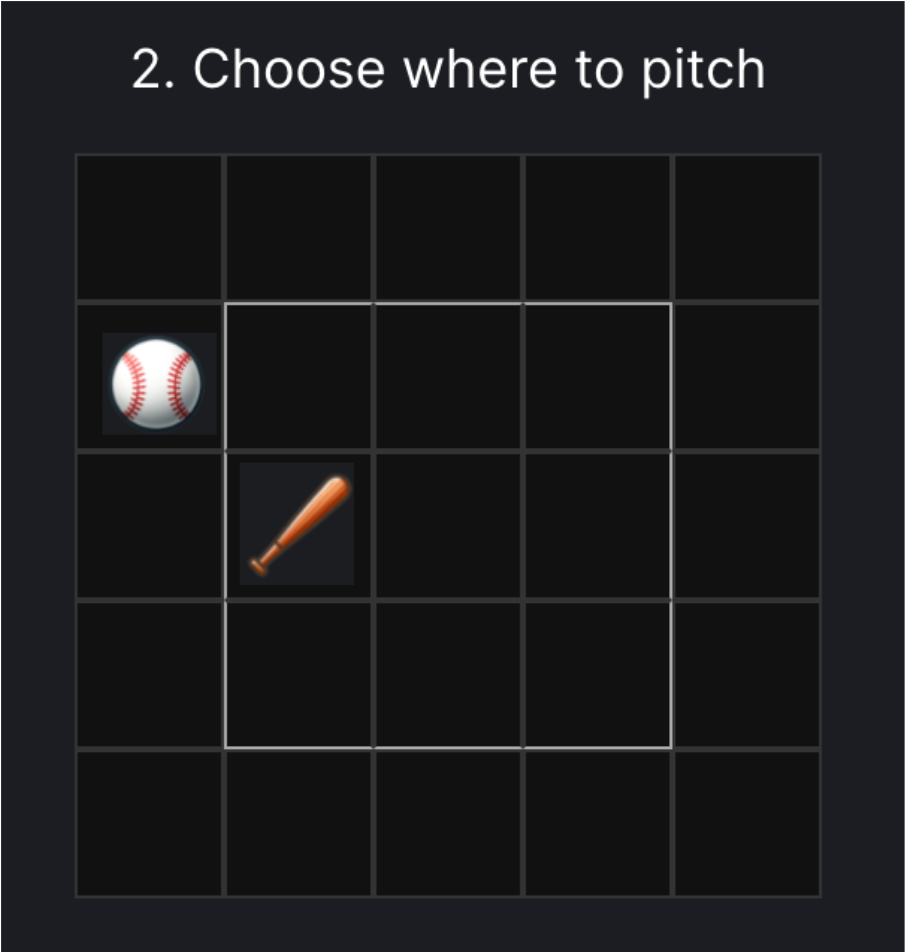

Both of the scenarios below fall into the GT2 category and have an equal likelihood of resulting in a strikeout (60%) or a homerun (1.4%).

Pitch penalty = 1.

While we wanted rare outcomes to be possible, to contribute excitement and suspense, players only see the grids, not the probability distributions. Seeing a grid with a distance of 7 or 8 produce a hit makes the game logic feel broken.

All outcomes above the red line–a large percentage of the possible outcomes–are handled by the same probability distribution.
Solution: Adding new distributions
Initially, we planned to add only a GT3 distribution and use the current GT2 numbers for a distance = 3 distribution. A distance greater than three would be an automatic strike.
Adding distance = 3 and GT3
| 0 | 1 | 2 | 3 | GT3 | |
| Strike | 0 | 500 | 2000 | 6000 | 10000 |
| Ball | 0 | 0 | 0 | 0 | 0 |
| Single | 4458 | 3185 | 1910 | 736 | 0 |
| Double | 1408 | 1005 | 603 | 241 | 0 |
| Triple | 126 | 90 | 55 | 23 | 0 |
| HR | 1008 | 720 | 432 | 0 | 0 |
| In-play out | 3000 | 4500 | 5000 | 3000 | 0 |
However, that addition raised further tuning concerns, addressed in the next section.
Problem 2: Balancing outcomes
New probability distributions compared with MLB averages
| 0 | 1 | 2 | 3 | GT3 | Total | % (/500) | MLB average | |
| Strike | 0 | 500 | 2000 | 6000 | 10000 | 18500 | 37 | 22.7 |
| Ball | 0 | 0 | 0 | 0 | 0 | 0 | 0 | 8.6 |
| Single | 4458 | 3185 | 1910 | 736 | 0 | 10289 | 20.578 | 14.1 |
| Double | 1408 | 1005 | 603 | 241 | 0 | 3257 | 6.514 | 4.5 |
| Triple | 126 | 90 | 55 | 23 | 0 | 294 | 0.588 | 0.4 |
| HR | 1008 | 720 | 432 | 0 | 0 | 2160 | 4.32 | 3.2 |
| In-play out | 3000 | 4500 | 5000 | 3000 | 0 | 15500 | 31 | 46.5 |
| 10000 | 10000 | 10000 | 10000 | 10000 | 50000 | 100 | 100 |
If you compare the distribution of outcomes yielded by adding the ‘3’ and ‘GT3’ distributions to the MLB averages for 2023, the Fullcount distribution is more heavily skewed toward strikes.
Of course, the Fullcount outcomes in this table shouldn’t match the MLB outcomes exactly, for several reasons:
- Takes: The table does not show results for takes, only for scenarios in which the batter swings. Adding in takes will add weight to the strike and ball probabilities.
- Fouls: Once we add them, foul balls will contribute to the strike count unless it is already at 2.
- Weighting: For an accurate comparison, we would need to use a weighted sum that takes into account the frequency of each distance. For example, batters are less likely to predict the pitch exactly (distance = 0) or to miss by the maximum possible (distance = 8) than to be slightly off (distance = 2, 3). We won’t know exactly how commonly each distance occurs until we have data from a number of games. We could simulate game outcomes in which players choose squares at random to estimate the frequencies, but it isn’t clear how close those numbers would be to the patterns of human play, as players don’t play randomly. (Human play takes into account data such as the opponent’s heatmap and is shaped by both intentional and unconscious patterns in the player’s choices.)
- Average miss distances: The strikeout percentages for each distance in Fullcount seem reasonable. For example, a player who swings high and inside when the pitch is delivered low and outside should have a high probability of striking out. However, it is probably more likely to miss that catastrophically in Fullcount, given the prediction mechanics, than in an MLB game. Results that make sense for the distance between the pitch and the swing in Fullcount may not naturally approximate MLB averages. In that case, we have to decide between making the game feel logical and have a satisfying level of difficulty (too easy = boring; too difficult = frustrating), on the one hand, and producing the ERAs and batting averages that players who follow professional baseball would expect.
We’ll need data from actual gameplay to finish the tuning process and account for all of these factors. For now, here’s what we did.
Solution: The plausible improbable
To rebalance the game, we worked from the following three premises:
- The game should feel logical in itself. Having the outcome match the scenario is more important than matching MLB averages at this stage. (Put differently, the outcome should match the players’ expectations when they see the hit and pitch locations on the strike zone grid, so that the gameplay feels logical and satisfying.)
- The game should be challenging but not too punishing.
- The game should be exciting. It’s okay to weight decisive victories (a strikeout or homerun) slightly more than less interesting outcomes (such as in-play outs, which don’t rely on the pitcher and batter characters who appear in the game).
To allow an exciting outcome that doesn’t shatter player expectations, we added a distribution for distance = 4. There is no chance of the player getting a hit, but it is possible to foul off the pitch and keep the game alive.
| 0 | 1 | 2 | 3 | 4 | GT4 | Total | % (/600) | MLB average | |
| Strike | 0 | 500 | 1500 | 5000 | 6000 | 10000 | 23000 | 38.33333333 | 22.7 |
| Ball | 0 | 0 | 0 | 0 | 0 | 0 | 0 | 0 | 8.6 |
| Single | 4458 | 3185 | 1910 | 736 | 0 | 0 | 10289 | 17.14833333 | 14.1 |
| Double | 1408 | 1005 | 603 | 241 | 0 | 0 | 3257 | 5.428333333 | 4.5 |
| Triple | 126 | 90 | 55 | 23 | 0 | 0 | 294 | 0.49 | 0.4 |
| HR | 1008 | 720 | 432 | 0 | 0 | 0 | 2160 | 3.6 | 3.2 |
| Foul | 1000 | 0 | 1000 | 1.666666667 | |||||
| In-play out | 3000 | 4500 | 5500 | 4000 | 3000 | 0 | 20000 | 33.33333333 | 46.5 |
At first glance, this makes things worse, because it weights the outcomes even more towards strikeouts. It’s unclear, though, how common distances of 4+ will be. It may not be a problem. What the distance4 category adds is a way to have an exciting/improbable outcome–an almost impossible save of the at-bat–without shattering player expectations by granting a hit with a huge distance between the bat and the ball. We can adjust the exact probabilities of foul versus strike, etc., as we get more data from gameplay.
To add to the excitement, we also rounded down the probabilities of a single and added the balance to the probabilities of a homerun in each distribution. It’s a small shift in favor of the maximally exciting outcomes. (The table below also includes percentages for foul balls, discussed in the following section.)
Before:
| 0 | 1 | 2 | 3 | 4 | GT4 | |
| Strike | 0 | 500 | 1500 | 4500 | 6000 | 10000 |
| Ball | 0 | 0 | 0 | 0 | 0 | 0 |
| Single | 4458 | 3185 | 1910 | 736 | 0 | 0 |
| Double | 1408 | 1005 | 603 | 241 | 0 | 0 |
| Triple | 126 | 90 | 55 | 23 | 0 | 0 |
| HR | 1008 | 720 | 432 | 0 | 0 | 0 |
| Foul | 0 | 500 | 1500 | 1500 | 1000 | 0 |
| In-play out | 3000 | 4000 | 4000 | 3000 | 3000 | 0 |
After:
| 0 | 1 | 2 | 3 | 4 | GT4 | |
| Strike | 0 | 500 | 1500 | 4500 | 6000 | 10000 |
| Ball | 0 | 0 | 0 | 0 | 0 | 0 |
| Single | 4000 | 3000 | 1800 | 736 | 0 | 0 |
| Double | 1408 | 1005 | 603 | 241 | 0 | 0 |
| Triple | 126 | 90 | 55 | 23 | 0 | 0 |
| HR | 1466 | 905 | 542 | 0 | 0 | 0 |
| Foul | 0 | 500 | 1500 | 1500 | 1000 | 0 |
| In-play out | 3000 | 4000 | 4000 | 3000 | 3000 | 0 |
Problem 3: Adding foul balls
In the next version of the Fullcount contract, players will play a full at bat, rather than a single pitch. To do this, we need to add foul balls to the outcome distributions.
Solution
I had planned to make space for foul balls by lowering the probabilities of strikes and in-play outs, but in the end I mostly left strikes alone. Strikes seem more exciting than in-play outs, as they are a direct part of the batter/pitcher duel, not dependent on the rest of the team. The strike probabilities already seem low enough, as well: there’s only a five percent chance of a strike if distance = 1, 20% if distance = 2, and 50% if distance = 3, at which point the bat and ball can be really far apart. We can revisit this decision when we have more data.
Distance = 3; 50% chance of a strike.
So, for now, the foul ball keeps the game alive when the outcome would have been an in-play out–an outcome not exclusively dependent on the batter/pitcher dynamic.
Outcome probability distributions with the addition of foul balls
| 0 | 1 | 2 | 3 | 4 | GT4 | Total | % (/600) | MLB average | |
| Strike | 0 | 500 | 1500 | 4500 | 6000 | 10000 | 22500 | 37.5 | 22.7 |
| Ball | 0 | 0 | 0 | 0 | 0 | 0 | 0 | 0 | 8.6 |
| Single | 4000 | 3000 | 1800 | 736 | 0 | 0 | 9536 | 15.89333333 | 14.1 |
| Double | 1408 | 1005 | 603 | 241 | 0 | 0 | 3257 | 5.428333333 | 4.5 |
| Triple | 126 | 90 | 55 | 23 | 0 | 0 | 294 | 0.49 | 0.4 |
| HR | 1466 | 905 | 542 | 0 | 0 | 0 | 2913 | 4.855 | 3.2 |
| Foul | 0 | 500 | 1500 | 1500 | 1000 | 0 | 4500 | 7.5 | |
| In-play out | 3000 | 4000 | 4000 | 3000 | 3000 | 0 | 17000 | 28.33333333 | 46.5 |
I’ve started the probabilities at 0 for d = 0, 5% for d = 1, and 15% each for d = 2 and d = 3. That looks low at first glance, but I suspect d = 2 and d = 3 are considerably more common than d = 0.
Once we have data from gameplay with these distributions, we’ll make another comparison with MLB stats to adjust the balance.
That’s all for this week! Thanks for reading. We’ll share another look at our development process in January.